University of Illinois Undergraduate Research Symposium 2025
Avian Conservation Through Spatial Data Analysis
Investigating how bird species adapt to climate-driven environmental shifts using satellite imagery and predictive modeling
Abstract
This research investigates how avian species have adapted to shifts in environmental conditions as a result of climate change. This has posed many challenges for both conservationists and researchers alike. The uncertainty of when and where bird species will migrate has made it more difficult to develop strategies to protect endangered populations.
Understanding habitat selection patterns for bird species is extremely important in the scope of conservation planning. As birds start to settle in new regions, they disrupt local food chains in their new habitats as well as their old ones, causing significant changes in their ecosystem.
This research aims to analyze these shifting patterns to help conservation efforts, biodiversity, and environmental stability.
Key Focus Areas
- -Climate-driven migration pattern changes across bird populations
- -Challenges in implementing effective conservation strategies
- -Habitat selection patterns critical for conservation planning
- -Ecosystem impacts from shifting bird populations
Methodology
To better understand where bird populations reside, grassland areas across the Midwest were labeled using data from the NASA MODIS dataset. Each grassland region was categorized as either a summer or winter habitat to account for variations in seasonal patterns.
Google Earth Engine was utilized to process satellite imagery and analyze land cover data. Grassland regions in the Midwest were identified through Normalized Difference Vegetation Index (NDVI) calculations.
NDVI is calculated by dividing the difference between near infrared lighting and red light by the sum of the two lights. Plants emit Near Infrared Light, so areas with high NDVI values are typically where grasslands are located. In these regions, vegetation data was extracted and analyzed.
NDVI Calculation
NDVI = (NIR - Red) / (NIR + Red)NIR = Near Infrared reflectance, Red = visible red reflectance
Tools Used
NASA MODIS Dataset
Satellite data for land cover classification
Google Earth Engine
Cloud-based satellite imagery processing
NDVI Analysis
Vegetation index for grassland identification
Machine Learning
Predictive algorithms for habitat modeling
Satellite Imagery
Grassland regions across the Midwest were identified and classified using satellite imagery and NDVI analysis. Below are examples of labeled green areas used in the habitat detection process.
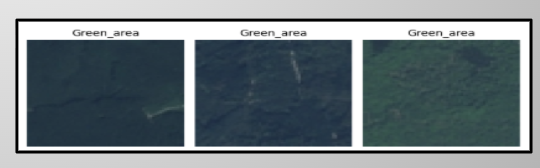
Fig. 1: Satellite imagery with grassland regions labeled as Green_area
Summer Habitats
Grasslands during warmer months showing peak vegetation density and optimal breeding conditions. High NDVI values indicate healthy plant growth.
Winter Habitats
Regions where bird populations migrate during colder months. These areas provide essential resources for survival during seasonal transitions.
Results
We were able to successfully label all grasslands across Illinois using NDVI indexes from satellite imagery. The results were consistent across different parts of the state and held up well during both summer and winter classifications.
After that, we trained a machine learning model that can reliably identify grassland regions through satellite inputs. The model performed well across seasonal changes and helped automate a big part of the habitat detection process.
Key Outcomes
- 1.Successfully labeled all grasslands across Illinois
- 2.Consistent results across different regions of the state
- 3.Effective summer and winter classifications
- 4.Trained ML model for automated habitat detection
- 5.Model performs well across seasonal changes
IL
State Coverage
2
Seasons Tested
ML
Automation
Future Work
For our future steps, we plan on building a machine learning model that predicts how likely a bird population is to settle in a specific grassland based on the environmental factors present in that region.
We're planning to consider factors like vegetation density (NDVI), land cover type, temperature, precipitation, elevation, and proximity to water sources. By feeding these into the model, we aim to generate probability maps that show where different bird species are most likely to thrive.
Right now, we're planning to use a Random Forest Classification model since it's great at handling multiple variables while making accurate predictions. We've also started looking into creating a neural network to push for even more accurate results.
On top of that, we're exploring MATLAB and its image processing capabilities to see if there's a way to refine our grassland classification even further and improve prediction accuracy across the board.
Environmental Factors to Analyze
Planned Approaches
Random Forest Classification
Handles multiple variables with accurate predictions
Neural Network Development
Exploring for improved accuracy
MATLAB Image Processing
Refining grassland classification